Establishment Survey Data
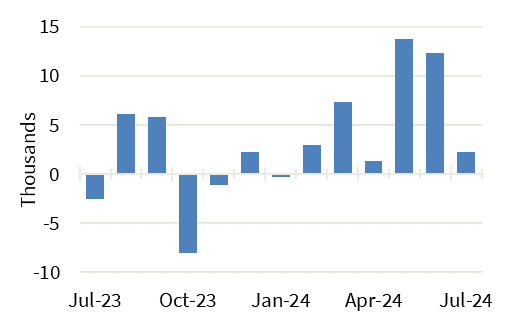
Ohio’s nonagricultural wage and salary employment increased 2,200 over the month, from a revised 5,667,500 in June to 5,669,700 in July, according to the latest business establishment survey conducted by the U.S. Department of Labor (Bureau of Labor Statistics) in cooperation with the Ohio Department of Job and Family Services (ODJFS).
Employment in goods-producing industries, at 942,500, increased 2,300 with gains in construction (+2,300) and manufacturing (+100) outweighing losses in mining and logging (-100). The private service-providing sector, at 3,940,900 increased 1,100, as gains in private educational and health services (+2,800); other services (+1,600); and trade, transportation, and utilities (+900) exceeded losses in professional and business services (-2,800) and financial activities (-1,400). Employment in leisure and hospitality and information did not change over the month. Government employment, at 786,300 decreased 1,200, with losses in local (-1,700) and federal (-100) government outpacing gains in state government (+600).
From July 2023 to July 2024, nonagricultural wage and salary employment increased 44,500. Employment in goods-producing industries increased 6,300, led by construction which added 8,300 jobs. Manufacturing lost 2,000 jobs, as decreases in durable goods (-3,800) outweighed gains in nondurable goods (+1,800). Mining and logging employment did not change over the year. Employment in the private service-providing sector increased 36,400 as gains in private educational and health services (+41,500); other services (+9,000); leisure and hospitality (+3,100); and professional and business services (+400) outpaced losses in financial activities (-13,800); trade, transportation, and utilities (-2,000); and information (-1,800). Government employment increased 1,800 as gains in federal (+1,700) and state (+1,000) government exceeded losses in local government (-900).
EDITOR’S NOTE: All data cited are produced in cooperation with the U.S. Department of Labor. Data sources include the Current Population Survey (U.S. data), Current Employment Statistics Program (nonagricultural wage and salary employment data), and Local Area Unemployment Statistics Program (Ohio unemployment rates). More complete listings of the data appear in the monthly Ohio Labor Market Review. Unemployment rates for all Ohio counties, as well as cities with populations of 25,000 or more, are presented in the monthly ODJFS Civilian Labor Force Estimates publication. Updated statewide historical data June be obtained through the OhioLMI app, which is available for free on mobile devices through the App Store or Google Play. Ohioans can access tens of thousands of job openings, for positions ranging from file clerks to CEOs, at https://ohiomeansjobs.ohio.gov.
News Release Dates
A calendar of 2024 release dates is available online at https://ohiolmi.com/Home/Events.
County, city, and metropolitan area unemployment rates for July 2024 will be posted online at https://ohiolmi.com on Tuesday, August 20, 2024. August 2024 unemployment rates and nonagricultural wage and salary data for Ohio will be released by ODJFS on Friday, September 20, 2024. This information and the monthly statistical summaries it is based on are also available at http://jfs.ohio.gov/ocomm.
Choose this link to view the table on the Ohio and U.S. Employment Situation.
Choose this link to view the table for the Nonagricultural Wage and Salary Employment Estimates for Ohio.
-30-
The Ohio Department of Job and Family Services manages vital programs that strengthen Ohio families. These include job training and employment services, unemployment insurance, cash and food assistance, adult protective services, and child support services.
|